Climate Change (Information Disclosure Based on TCFD Recommendations)
Method of disclosure of emissions calculation
Environmental initiatives began in FY2000 with activities to obtain and maintain ISO certification. However, in addition to energy saving activities in the Company as a measure to address increasingly severe global warming, we have made the transition to decarbonization activities throughout the entire value chain, and changed course toward activities in accordance with the Greenhouse Gas Protocol in support of TCFD since FY2022.
Due to the nature of being a trading company, the Company’s Scope 1 and 2 emissions could be considered to be relatively low for the size of the business. We recognize that it is our social responsibility to utilize our characteristics as a distribution trading company to promote decarbonization of the entire supply chain involving suppliers and buyers.
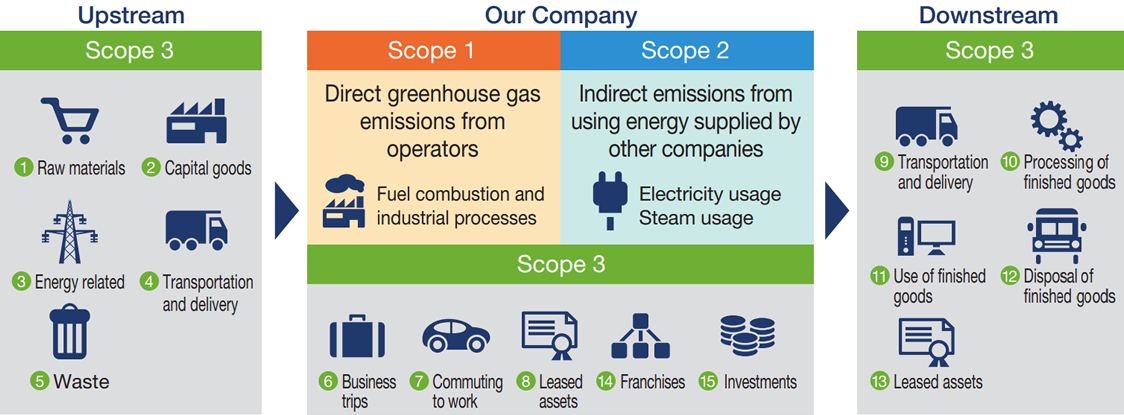
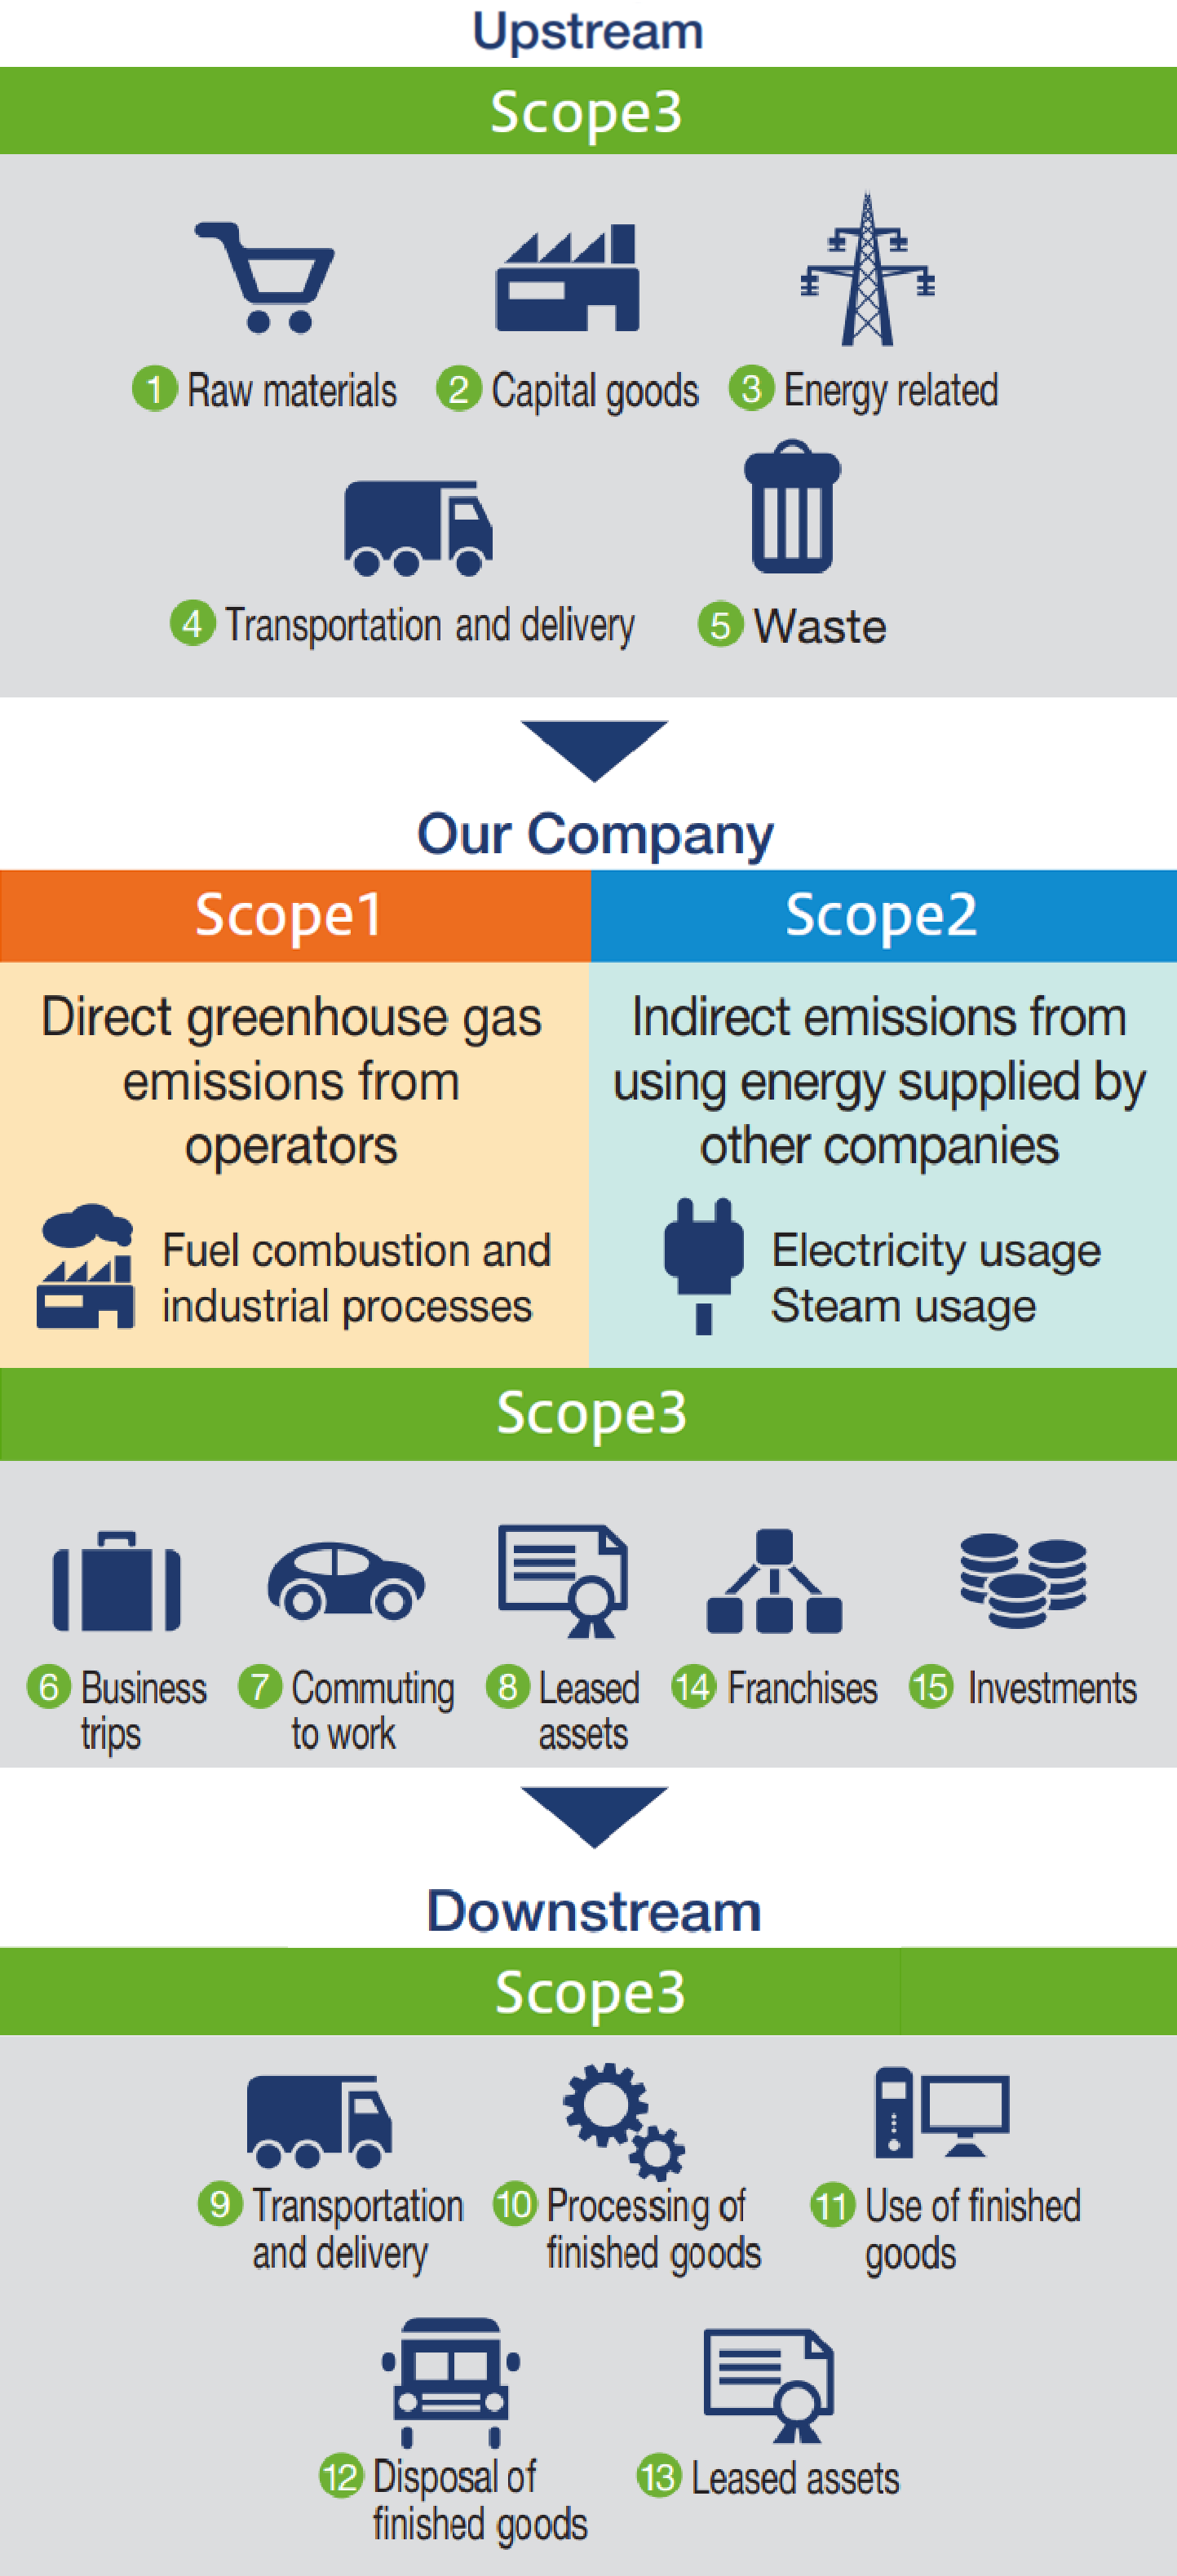
We have introduce a SaaS-type decarbonization calculation application as a “GBP App” for ascertaining the Company’s Scope 1, Scope 2 and Scope 3 emissions by category.
This is a partially customized version of the cloud service provided by Zeroboard, Inc., and enables determination of the total volume by having key locations and group companies worldwide input data, and the visualization of progress of decarbonization using monthly and yearly comparisons.
Along with this, we also aim to strengthen activities through collaboration by providing it to the Company’s supply chain for a charge or at no charge.

Environmental Management System
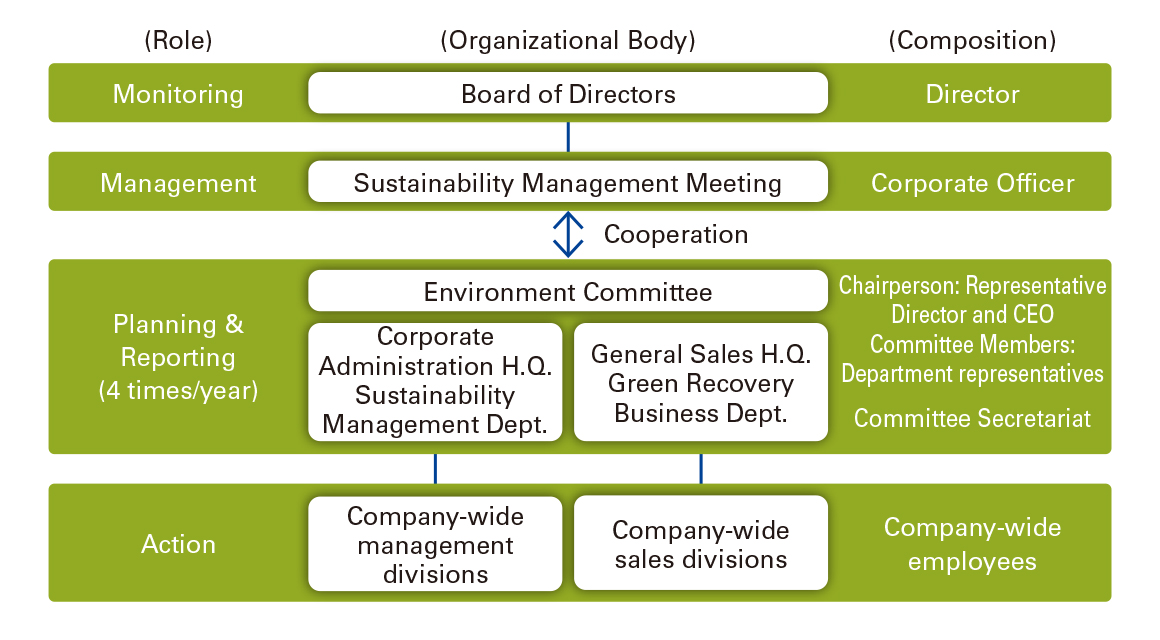
The chief operating officer responsible for climate change issues is the CEO, with the Sustainability Management Meeting as the managing body. The body was established in April 2023 and confirms policies, action plans and progress at least once per year. In addition, practical measures are carried out by the Environment Committee, which is made up of members from various departments, and meets four times per year to discuss policies and identify issues. The roles and composition of each body are shown in the diagram on the right.
Recognition of Risks and Opportunities
Climate change risks
*The table below can be scrolled left or right.
| Type of Risk | Main Climate-Related Risks | Potential Impact on Business | Timeframe | Response | |
|---|---|---|---|---|---|
| Transition | New regulations and policies |
Carbon tax (carbon tax or emissions trading) and laws related to global warming |
|
Medium term Long term |
|
| Technologies | Transition to low GHG emissions technology |
|
Medium term Long term |
|
|
| Markets | Changes in customer consumption behavior |
|
Long term |
|
|
| Reputation | Decline in stakeholder trust due to inappropriate response |
|
Short term Medium term Long term |
|
|
| Physical | Acute physical risks |
Increased severity of weather events (storm and flood damage) |
|
Short term Medium term Long term |
|
| Chronic physical Risks |
Changing temperatures (atmospheric, freshwater and ocean) |
|
Medium term Long term |
|
|
Short term: 1–3 years; Medium term: 3–10 years; Long term: 10–30 years
Climate change opportunities
*The table below can be scrolled left or right.
| Opportunity Type | Main Climate-related Opportunity Factors | Potential Impact on Business | Timeframe | Response | |
|---|---|---|---|---|---|
| Opportunities | Resource efficiency |
Use of more efficient production and distribution processes |
|
Short term Medium term Long term |
|
| Energy sources |
Use of supportive policy incentives and use of lower-emission sources of energy |
|
Short term Medium term Long term |
|
|
| Products and services |
Development/expansion of low-emission goods and services |
|
Short term Medium term |
|
|
| Development of climate adaptation, resilience and insurance risk solutions |
|
Short term Medium term |
|
||
| Markets | Access to new markets |
|
Short term Medium term |
|
|
| Physical | Resilience | Increased severity of weather events (storm and flood damage) |
|
Short term Medium term Long term |
|
Short term: 1–3 years; Medium term: 3–10 years; Long term: 10–30 years
Emissions records are listed in Non-Financial Highlights on pages 74 to 75.
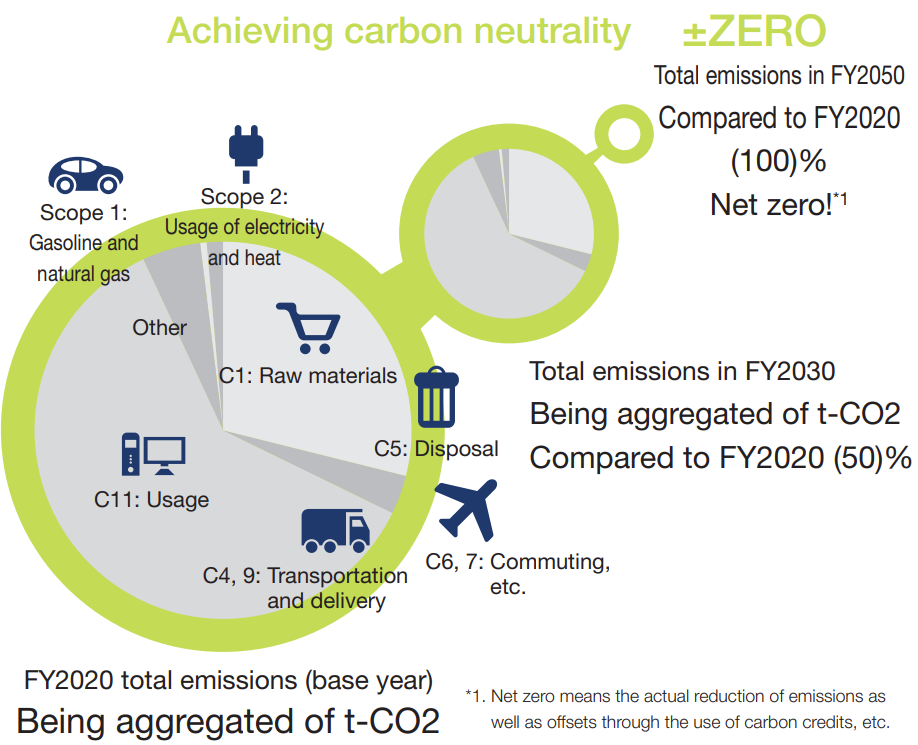
Carbon Neutral Roadmap
Due to resources, FY2020 is used as the base year for determining the Company’s emissions. The figures include some currently being aggregated, but we aim to reduce the total amount by 50% by FY2030 and be effectively carbon neutral by FY2050.
Much of the Company’s Scope 1 is accounted for by gasoline consumption such as sales vehicles. We will sequentially replace existing hybrid vehicles with EVs. Furthermore, much of Scope 2 is accounted for by electricity consumption in offices and logistics facilities, and we aim to significantly reduce CO2 emissions in the medium- to long-term by switching to electricity from renewable energy and introducing energy-saving air-conditioning and lighting. Due to a lack of resources, Scope 3 is currently being aggregated, but we aim to halve these emissions by FY2030 and reduce them to net zero by FY2050.
Emissions
| Item | Unit | FY2021 | FY2022 | FY2023 | FY2024 |
|---|---|---|---|---|---|
| Power consumption | kWh | 11,779,372 | 13,705,056 | 13,004,572 | 13,428,691 |
| CO2 emissions (Scope 1) | t-CO2 | 2,411 | 4,862 | 6,548 | 6,635 |
| CO2 emissions (Scope 2) Location-based method | t-CO2 | 5,181 | 5,433 | 5,198 | 5,331 |
| CO2 emissions (Scope 2) Market-based method | t-CO2 | 5,493 | 4,960 | 4,640 | 4,674 |
| CO2 emissions (Scope 3) Category 1 Purchased goods |
t-CO2 | 129,704 | 144,393 | 148,502 | 146,284 |
| CO2 emissions (Scope 3) Category 4 Upstream transportation and distribution |
t-CO2 | 15,907 | 9,616 | 10,582 | 11,593 |
| CO2 emissions (Scope 3) Category 5 Waste generated in operations |
t-CO2 | 63 | 56 | 55 | 54 |
| CO2 emissions (Scope 3) Category 11 Use of sold product |
t-CO2 | 1,423,349 | 1,006,777 | 1,381,162 | 1,315,877 |
| Vehicle fuel consumption | ℓ | 952,166 | 1,885,630 | 2,503,866 | 2,555,952 |
| Amount of waste produced | t | 197 | 184 | 178 | 181 |
-
Note: 1. Regarding CO2 emission calculations
-
• Calculation method:Calculated in accordance with the GHG Protocol (Scope 3 Categories 1 and 11 are calculated based on our private brand home appliance products).
-
• Calculation scope:Targeted bases include YAMAZEN CORPORATION and its Group companies, totaling 24 entities based on the management control standard. Countries and regions covered are Japan, China, South Korea, Taiwan, Thailand, Vietnam, the Philippines, Singapore, Malaysia, Indonesia, USA, Mexico, Germany and Czech Republic.
2. Note that figures for each year may differ from previously disclosed information due to adjustments made for accuracy.
Avoided Emissions
| Item | Unit | FY2021 | FY2022 | FY2023 | FY2024 |
|---|---|---|---|---|---|
| Number of Green Ball Project participants/Tons of emissions reduced |
Companies | 682 | 655 | 639 | 680 |
| t-CO2 | 40,701 | 40,947 | 37,709 | 40,231 |
Initiatives
Major domestic sites gradually switching to electricity from renewable energy Plans for nationwide rollout starting with sites under control of Osaka Corporate H.Q.
In order to reduce the Company’s Scope 2 emissions (indirect emissions from energy), we switched the power of Buildings 1 2 and 3 of the Osaka Corporate H.Q. to “D-Green RE100” electricity from renewable energy from Osaka Gas Co., Ltd. in July 1, 2022, and did the same in the Logis Osaka (Daito-shi) on November 4.

This is expected to reduce annual emissions by 595t-CO2.This electricity satisfies the requirements of “RE100” because the electricity from renewable energy is supplied with non-fossil certification with tracking information. In this way, the Company is proceeding to switch the major sites it owns (Nagoya, Kyushu, Hiroshima, etc.) to electricity from renewable energy.
Unique Engagement (Collaboration) Initiatives in Environmental Activities – YAMAZEN’s WAY
It is assumed that Category 11: Use of sold products in Scope 3 accounts for much of the Company’s emissions. In order to reduce emissions in this category, which are difficult to identify and aggregate, we believe it is our responsibility as a distribution trading company to sell and promote energy-saving equipment with low environmental impact. We began the aforementioned Green Ball Project in 2008, and have endeavored to spread environmentally friendly products with supporting manufacturers, participating business partners and users. The “GBP App” mentioned above is being provided from FY2022 to companies participating in the project, and we will support determination of the total amount of emissions using the Greenhouse Gas Protocol and visualization of the contribution to reduction using the GBP Protocol.
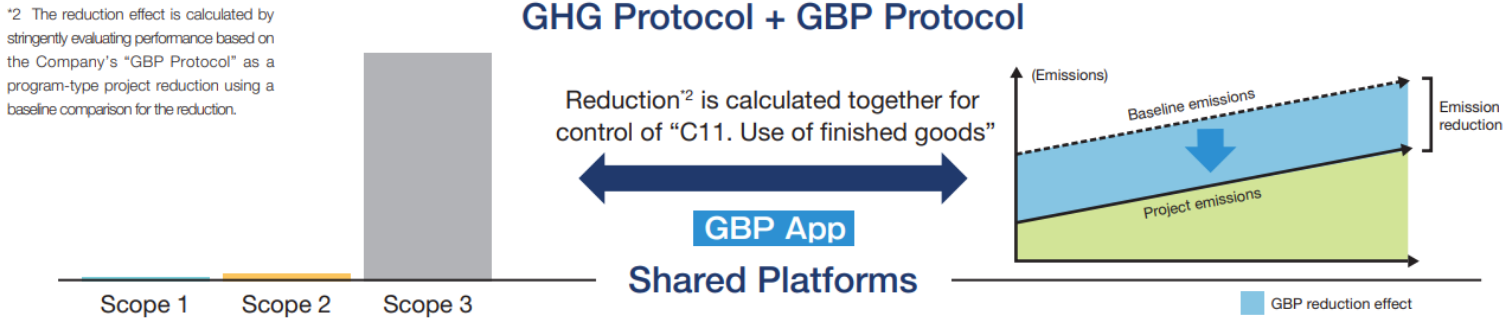
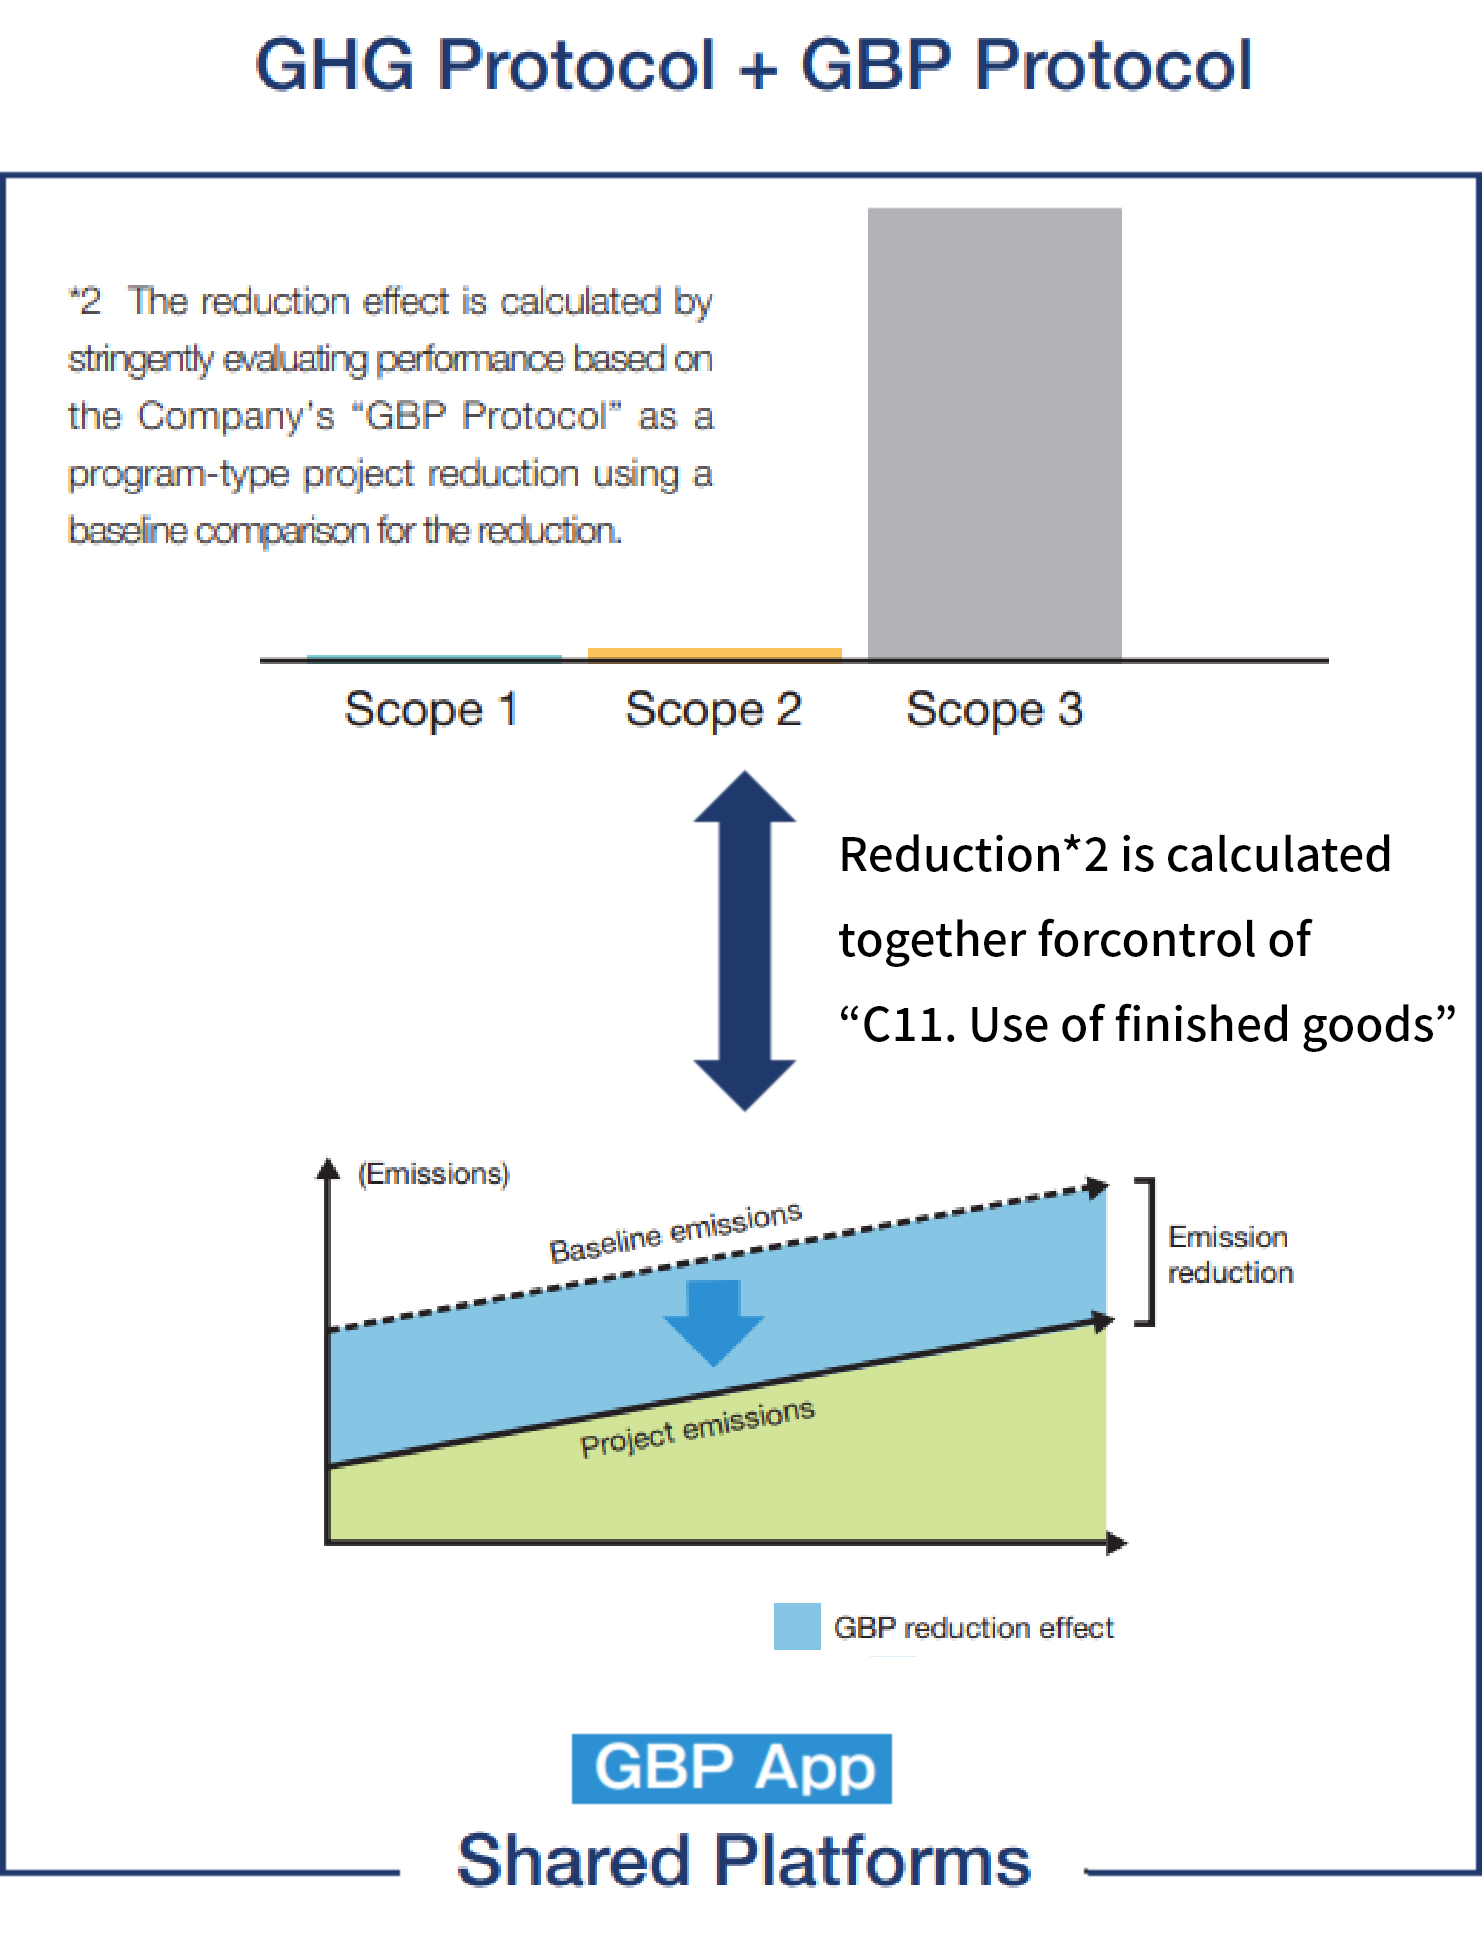
We provide the Green Ball Project Application (GBP App), the Company’s dedicated app for visualization of internal emissions and progress management of reductions, to companies participating in the Green Ball Project at no charge, supporting the visualization of emissions and the visualization of reduction effects in the downstream supply chain. While it is a matter of course to curb and reduce emissions within the Company, in addition, we aim to produce further effects by vigorously focusing on the sale of environmentally friendly products to curb emissions in Scope 3 “Category 11: Use of sold products,” that are the greatest source of emissions as a distribution trading company.